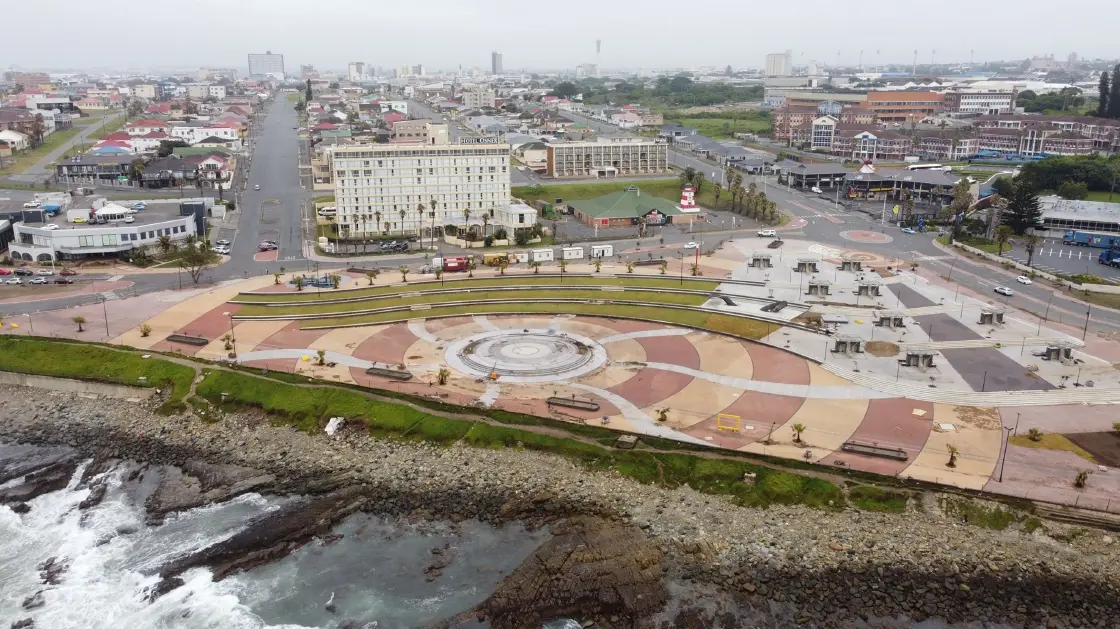
Buffalo City was the country's biggest metropolitan spender on infrastructure per resident in 2022, but the ranking has since changed as financial pressures have increasingly squeezed municipal investment.
The shift is highlighted in a recent Statistics South Africa analysis of municipal capital expenditure, which uses Census 2022 figures to compare spending across municipalities and draws on more recent expenditure and population data to examine the changing position of the country's metros.
Buffalo City topped the metropolitan rankings in 2022, ahead of Johannesburg and Cape Town.
But Stats SA says that more recent figures show a different picture, with Johannesburg now trailing Cape Town and eThekwini in capital expenditure per capita.
The analysis also identifies Tshwane as the metro with the lowest per-capita capital spending in 2024, followed by Ekurhuleni.
While Stats SA does not specify Buffalo City's exact position in the 2024 ranking, its analysis makes clear that the order has changed since the 2022 comparison.
Capital expenditure is the money municipalities invest in infrastructure and long-term assets, including roads, water and electricity networks, sanitation facilities and public buildings.
Operational spending, on the other hand, covers the day-to-day costs of running a municipality.
The distinction is increasingly important as municipalities face pressure to maintain ageing infrastructure while meeting rising service demands.
Stats SA's national figures put municipal capital expenditure at R56.5bn in 2022. Against a population of about 62-million, that amounted to roughly R910 per person.
The provincial comparison placed the Western Cape first for per-capita municipal capital spending, with the Eastern Cape in second place and the Northern Cape third.
However, per-capita spending is not a measure of whether infrastructure projects are completed successfully, whether services are reliable or whether residents in different parts of a municipality benefit equally.
It is a broad measure of the amount invested relative to the population.
The figures also need to be read with care in the Eastern Cape, where large rural areas and different levels of infrastructure need can make comparisons between municipalities difficult.
District municipalities are not included in the same way as local municipalities in the comparison, which may affect the picture of spending in predominantly rural areas.
The Stats SA analysis also points to the importance of how municipalities fund capital projects.
It notes that Ekurhuleni relies heavily on conditional grants from national government rather than internally generated revenue to finance its capital expenditure.
The changing metro rankings come into sharper focus against research into Johannesburg's municipal finances by Genesis Analytics, presented recently to Business Leadership SA.
In a report published by Engineering News in June, the research found that Johannesburg's operating expenditure had grown by 92.5% in real terms since 2010, while capital investment had contracted by 12.8%.
Capital expenditure's share of the city's total spend fell from about 17% in 2010 to about 7% in 2025.
The research warns that the widening gap between operating and capital spending threatens long-term service delivery, arguing that the city would have to reduce operating costs and find ways to increase infrastructure investment.
For Buffalo City and other municipalities, the lesson is that a high position in a spending table is no guarantee of lasting progress.
What matters is whether investment is sustained, infrastructure is maintained and capital projects translate into better services for residents.
The real test of municipal spending is not the amount recorded per person, but what residents can see, use and rely on.